The Observation Network Created by the Earthquake Proves Useful for Accurate Timekeeping (Part Two of Two) - A Solution to the "Mr. Higgins Problem" in Space -

Oct 6, 2023
The human body responds to both high temperatures and high humidity. As I watch the recent weather reports on record-high temperatures and lingering late-summer heat, I am reminded of an unusual digital stationery product I used about 30 years ago. I'm talking specifically about the UC-500, a small calculator from Casio Computer Co., Ltd. that came equipped with a thermometer and clock as well as a hygrometer (humidity meter).
In the early 1990s, when mobile phones had not yet become widespread, electronics retailers competed by offering the most elegant and attractive compact electronic goods with the greatest numbers of features. It may sounds odd, Casio continuously updated its calculator features from one model to the next, adding sensors to measure temperature, humidity, battery voltage, UV rays and more. The UC-500 represents one of these advancements. As a side note, I believe that the natural culmination of this steady upward trend in feature inclusion is Casio's G-Shock series of multifunctional digital watches.
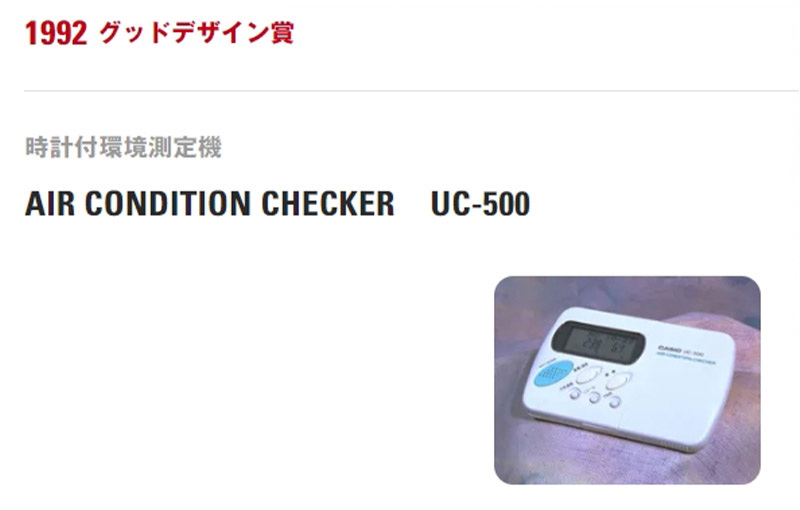
Casio UC-500 AIR CONDITION CHECKER (environmental measurement device with clock)
Source: 1992 Good Design Award winner in the "Product Design" category, as shown on the Good Design Award
website: https://www.g-mark.org/gallery/winners/9cc85984-803d-11ed-862b-0242ac130002
After measuring the temperature and humidity, the UC-500 would display simple, descriptive phrases such as kaiteki ("comfortable"). When temperature and humidity were extremely high, it would display the phrase "Amazon"; I remember this clearly because I saw this phrase displayed when I was actually in Brazil's Amazon Rainforest!
It took me 30 hours, taking three different flights and eating 6 onboard meals in a row, to make the long journey from Japan to the major Brazilian city of Manaus, which is on the Amazon River. From there, I took a small aircraft and boat for an entire day and night to reach Nhamundá, a small village of several thousand people. After arriving at my lodging place and unpacking my things, I glanced at the UC-500 and saw that it did, indeed, display the word "Amazon." I was exhausted from the high humidity and the heat, and at the time it felt as if the little device was both pulling my leg and trying to cheer me up. I recall laughing to myself and saying, "That's right, it is the Amazon!"
The reason I became interested in that digital stationery product, and the reason I ended up taking it with me to the Amazon, was that it was very uncommon at the time to find a portable-sized hygrometer at a reasonable price. Compact electronic hygrometer devices such as the UC-500 utilize a moisture-absorbing medium for the sensor, which collects moisture in the air and estimates the humidity level based on changes in electrical properties such as capacitance and resistivity. By design, this type of device is only able to determine rough humidity-level percentages and cannot display humidity down any decimal level, which is why they often feature a disclaimer such as "displayed value ±10%." However, it is unlikely that the user will need to know the humidity level beyond that level of precision in their day-to-day life.
Devices such as those described above are for amateur users. Among professionals in certain fields, however, it is necessary to measure water vapor, or precipitation, content with greater precision. This applies, of course, in the world of weather forecasting.
Rainfall is the result of water vapor in the air condensing to form clouds, from which water (in liquid form) descends to the earth below. Because water as a substance stores large amounts of latent heat, this process results in large-scale transfers of energy. Therefore, it stands to reason that the ability to precisely observe water vapor amounts, which have major effects on weather patterns, over a wide-reaching area and in real time will boost forecast accuracy. In other words, finding a lining of the clouds can improve the accuracy of weather forecasts. And GNSS actually play a major part in this.
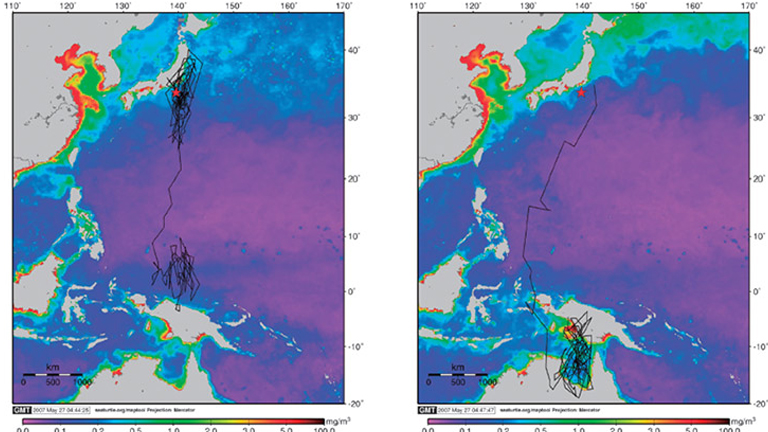
Since 2009, the Japan Meteorological Agency has utilized "precipitable water vapor" values, or PWV values, in their computer-simulation-based meteorological forecasting (numerical forecasting) system. Said PWV values are the result of analyses using data from the Geospatial Information Authority of Japan's GEONET—"GNSS Earth Observation Network System," an observation network comprising approximately 1,300 electronic reference points nationwide—and researchers are pursuing continual improvements to boost accuracy.
PWV values represent total amounts of water that can potentially turn into rainfall, and serve as indicators of precipitation amounts in the air. Regarding the ability to measure this value based on GNSS observation, allow me to quote a description from an online textbook used by the Geodetic Society of Japan to teach beginner-level learners:
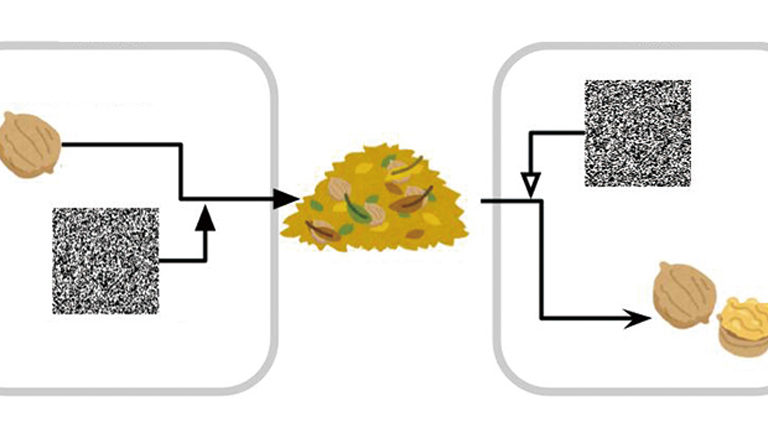
"Meteorologists are constantly looking for new ways to improve the accuracy of numerical values used in weather forecasts. At the same time, geodesists [scientists in the field of geodesy, which is concerned with measuring aspects of earth such as size, shape, gravity, and positioning of certain points] encounter problems.
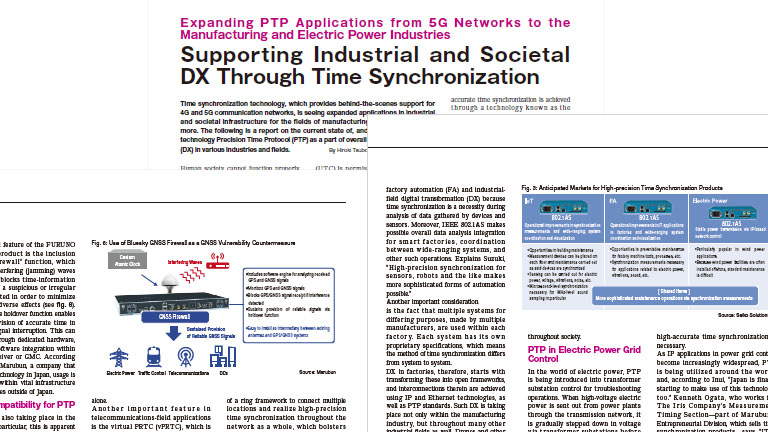
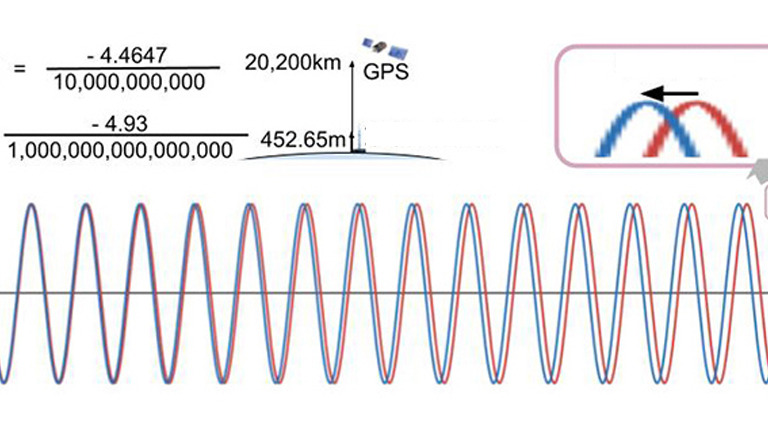
It is the signal delay. Uneven delay of microwaves transmitted from GPS satellites are caused by uneven distribution of water vapor in the atmosphere. In particular, this phenomenon interferes with precision in vertically oriented measurements, creating countless problems for geodesists in the form of measurement error, despite their efforts to improve measurement precision. GPS meteorology is the result of a happy coincidence: meteorologists require acquisition of water vapor measurement as signals, while geodesists need that as noises."
Source: GPS Kishogaku ("GPS Meteorology"), Sokuchigaku Shinsoteiban Dai-3-bu Oyo-Hen ("Geodesy Revised Edition Part Three: Applications"), https://geod.jpn.org/web-text/part3_2005/tsuji/tsuji-1.html
Water vapor creates measurement error in the field of geodesy, meaning that more precise measurement of water vapor can lead to greater accuracy in geodesic measurement results. At the same time, meteorologists can increase the accuracy of their forecasts through more precise water vapor measurement. The result is a win–win situation for both sides, as well as the emergence of a new field known as GPS Meteorology. By the 1990s, GPS measurement stations had become capable of precision down to the millimeter. At the same time, scientists became capable of measuring PWV values with sufficient precision. These advances enabled data with far higher spatial and temporal resolution than had been possible using traditional radiosondes, which are measurement devices carried into the air via weather balloons. The resulting advantages to scientists were significant.
The term "weather lore" traditionally refers to the act of visually observing the sky and clouds in order to predict the weather. Many people have heard of Japan's AMeDAS (Automated Meteorological Data Acquisition System) observation network and the Himawari weather satellites, but few are aware that GNSS satellites and their continuous observation of radio waves also play a role in weather forecasting. It is an interesting topic to explore.
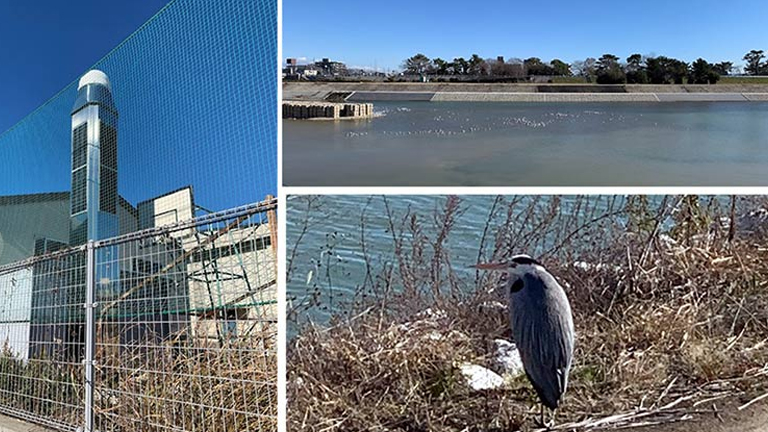
In addition to observation and measurement of GNSS radio waves coming to earth from space, experiments are underway to utilize measurements of these waves as they reach the earth's surface to clarify precipitation amounts and distributions in greater detail. This is accomplished using digital terrestrial transmission waves. Transmission towers such as TOKYO SKYTREE utilize either atomic clocks, GNSS-based time synchronization systems, or a combination of both to maintain highly stable frequencies. And because these facilities emit broadcast waves, their output is powerful and the quality of their radio sources very high.
In 2017, the National Institute of Information and Communications Technology (NICT) announced their successful development of a precipitation-amount estimation method that utilizes digital terrestrial transmission waves. Through this approach, direct and reflected waves are analyzed in order to determine amounts of delay along reflected-wave propagation paths as a means of estimating precipitation amounts along said paths. According to an NICT document, "If precipitation increases by 1% along a 5-kilometer propagation path, the resulting delay will be approximately 17 picoseconds [1 picosecond = one-billionth of a second]." A radio wave progresses over a distance of only about 5 millimeters in 17 picoseconds' time.
The phenomenon of "ghosting" encountered in the days of analog TV broadcasting, which caused disturbances in picture quality, was a visual representation of such delays in reflected waves. Digital broadcasting uses signal processing to eliminate such issues, whereas the completely separate scientific field we have been discussing here—measuring precipitation distributions in the atmosphere—aims to actually measure, with high precision, such delay-related information canceled out by TV-broadcaster signal processing. It is a fascinating area of research indeed.
The approach of measuring precipitation amounts using GNSS systems is effective in terms of vertical-direction radio-wave propagation from satellites. However, estimating precipitation using horizontally propagating waves from digital terrestrial broadcasting facilities offers the advantage of clearly showing planar expansions of said waves over the earth's surface. As a precondition, both approaches require wave-broadcasting equipment with reliable time synchronization and stable frequencies.
Both methods have garnered widespread interest as promising methods for early prediction of disaster-level heavy rains, linear precipitation zones and the like, and research toward practical implementations in these areas is expected to make progress in the coming years. Underpinning all of these advancements is the clock: if we can ensure excellent precision in our timekeeping devices, then we can surely develop a greater understanding of the precipitation and the clouds.
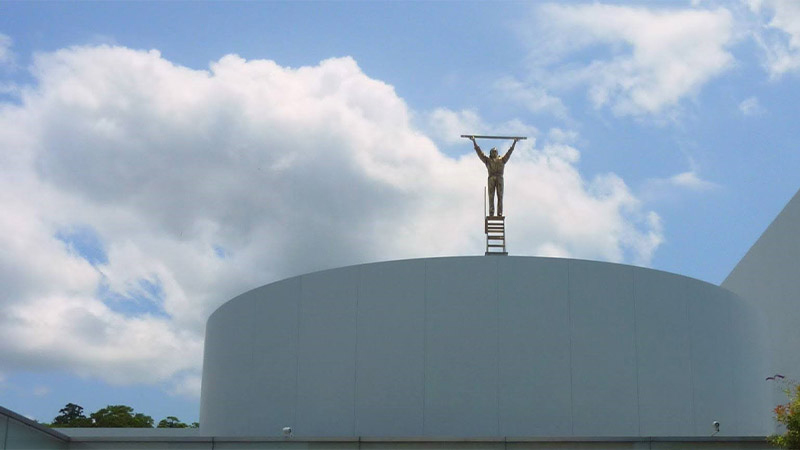
The Man Who Measures the Clouds by Belgian artist Jan Fabre. A permanent installation made of bronze and installed at 21st Century Museum of Contemporary Art, Kanazawa. Photograph by the author.
Born in Ishikawa Prefecture in 1964. Based on his experience in covering industrial technology, cutting-edge technology, and space development, he is passionate about unraveling and conveying difficult topics in an interesting way to people of all ages, from children to senior citizens. From 2009 to 2014, he was a member of the editorial board of "JAXA's," the official magazine of the Japan Aerospace Exploration Agency. Author and co-author of the following books: 『あなたにもミエル化? ~世間のなりたちを工学の視点から~』(幻冬舎mc)、『私たちの「はやぶさ」その時管制室で、彼らは何を思い、どう動いたか』(毎日新聞社)、『東京大学第二工学部70周年記念誌 工学の曙を支えた技術者達』(東京大学生産技術研究所) etc.,
_1.jpg)
_1.jpg)
_1.jpg)
_1.jpg)
_1.jpg)